
How to Create a Social Media Report (Includes a Free Template)
A smart, simple, and easy-to-understand social media report is key to proving the value of your social marketing plan. It’s a concrete, data-driven way of showing what you’ve accomplished.
A good social media report can also help guide your actions as you incorporate lessons learned from campaigns and other activities.
Bonus: Get a free social media report template to easily and effectively present your social media performance to key stakeholders.
What your social media report should include
A social media report can be anything from a bare-bones spreadsheet listing raw numbers to a spiffy slide presentation packed with analysis. It all depends on the purpose of your report.
When you’re deciding what to include in your own, ask yourself the following questions:
- Who is your target audience?
- Are you reporting on ongoing results or a specific campaign?
- What information is most relevant in this context?
Your answers will guide how you structure the document.
Here is a basic outline to get you started. Consider it the foundation of our social media report template, which you can download for free below. Mix and match the sections to create a custom social media reporting tool that works for your intended audience and needs.
Introduction
Start your social media report with a quick summary of the intended goals, strategy, tactics, and success metrics. This provides context so your readers understand what to expect in the rest of the report.
Success snapshot
Next, provide a quick snapshot of the campaign’s performance (or of your monthly or weekly performance, if it’s a regular report). This is just a quick overview of the most important results.
For example, you might want to list high-level data like total new followers, total engagements, or total website traffic. You’ll get into the details in the next section.
Data tracking
This section is all about the numbers.
For context, it’s a good idea to provide some previous results as well. If you’re reporting on a campaign, look for a similar past campaign so you can compare what you achieved. If you’re creating a regular weekly or monthly report, track your results compared to the previous several weeks or months so you can start to see any ongoing trends.
The specific data you’ll want to include in your social media marketing report will depend on the goals and related metrics that you’re tracking, but here are some of the most common numbers to include for each social network:
- Number of posts
- Net followers gain or loss
- Number of likes
- Post reach
- Number of comments
- Number of shares
- Number of page/profile views
- Number of clicks on post links
- Number of clicks on the link in your bio
- Number of story views
- Number of video views
- Top performing post(s)
In addition, you may want to report on the following overall data:
- Number of leads generated
- Number of conversions
- Total revenue generated
- Total spent (on social ads)
- Social share of voice
- Social sentiment
Of course, you can include much more data if it’s relevant to your campaign objectives. For a full breakdown of all the numbers you might want to include in your social media report, check out our post on social media metrics that really matter.
Other standout results
Sometimes the numbers don’t fully capture the results of a campaign. Maybe you made contact with a key influencer for the first time. Or maybe a particularly compelling testimonial came in through social that you’ll be able to use in future marketing campaigns.
Include room in your social media report to report on all forms of success that are relevant to your goals.
Analysis
This is where you go beyond simply reporting the numbers to analyze what the data actually means.
For example, rather than simply reporting the number of engagements, you might want to analyze the number of engagements per post or per follower. And rather than simply reporting the number of clicks you drove to your website, you might want to analyze how much of total website traffic is coming from social campaigns.
Again, make sure to provide context by comparing your results to previous campaigns, or to what you know about competitor campaigns.
If you can, try to analyze your data to determine why you got the results you did. The facts are interesting, sure, but the reasons behind the data are what can help you tweak your strategy and set meaningful social media goals.
Conclusion
End your report by summarizing what you learned, and how those lessons will help guide your future strategy.
Social media reporting tips
Keep it simple
Your report should look nice and be easy to follow. There’s no need to go overboard with crazy formatting or unnecessary details. Let your data tell the story.
Focus on predetermined social goals
Social media can help drive awareness, sales, leads, engagement—the list goes on. Make sure to stay laser-focused on the KPIs and metrics that matter most to your business. Don’t get bogged down by reporting on additional stats unless you notice a major spike or something else noteworthy.
Know your audience
As mentioned above, it’s important to tailor your report based on who’s going to read it. Is this report meant for your boss, your marketing team or VPs?
You might need to make multiple reports to suit different audiences.
Focus on what’s important to each audience, instead of forcing everyone to dig through to find what’s relevant to their jobs.
If you’re writing a report for your team, you can get into granular detail about the campaign. What worked well, and what wasn’t so great? Capture all of this in your social media report. This makes your report a valuable to help you avoid mistakes and repeat successes next time.
The higher up you go in your company, the more concise your report needs to be. Figure out what’s important to your bosses and focus on those numbers and facts.
In some cases, you might want to create social media reports just for your own reference. In that case, you likely don’t need an introduction and conclusion.
Just stick with the relevant data and include enough context so that the information is available and easy to understand for future analysis.
Social media report template
Bonus: Get a free social media report template to easily and effectively present your social media performance to key stakeholders.
If you’d prefer to create your own social media report template, you can do so using a program like Excel or Google Docs if you’re going to focus primarily on numbers. For reports with more analysis, use a spreadsheet to gather your data, then present it in a document or slide presentation.
Or, use a social media reporting tool like Hootsuite Analytics to build custom reports, complete with charts and graphics, and export them as a spreadsheet, PDF, or PowerPoint.
Social media reporting tools
The data in your social media report is based on analytics—either from the individual social networks themselves or from a centralized social media reporting tool like Hootsuite.
Here’s where you can find the data you need for your social media report on each of the social networks.
Facebook Insights
Head to your Facebook business page and click Insights in the top menu. You’ll see data for all your major metrics, presented in a visual way.
You can click through various reporting options in the left menu to see more detailed information about likes, reach, actions on your page, and more.
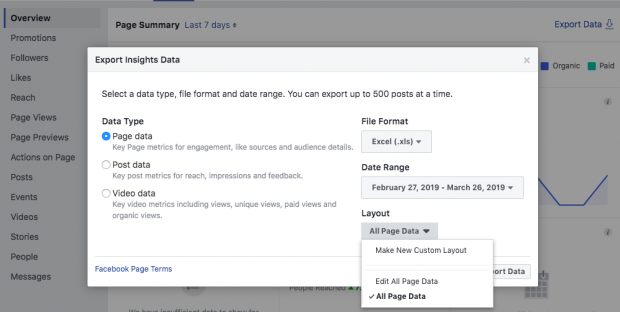
To export data to include in your social media report, click Export Data on the top right of the Insights page, and choose which data to export and the format that works best for you (.xls or .csv).
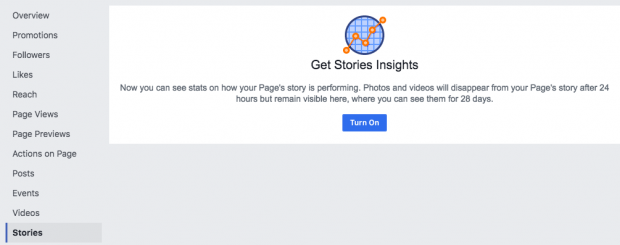
Most Facebook data for your business page is tracked automatically, but if you want to report on data for your Facebook Stories, you’ll have to manually turn that option on. In the left menu of your Insights page, click Stories, then click the blue Turn On button.
Twitter Analytics
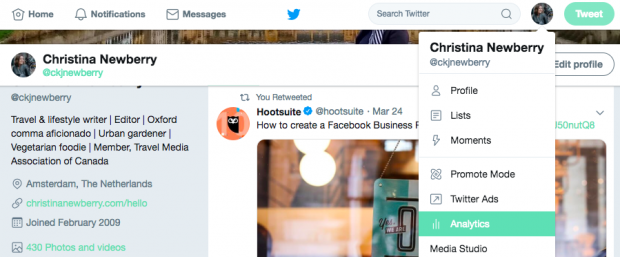
Open your Twitter profile and click on your avatar on the top right of your screen. Click Analytics in the drop-down menu.
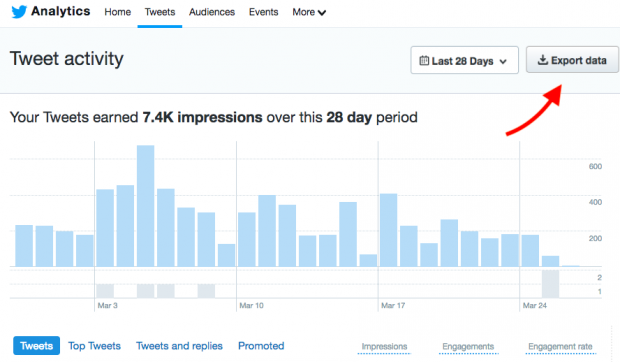
You’ll find key data on the main analytics screen. To find more detailed information, click through the options like Tweets or Audiences in the top menu of your Twitter Analytics screen. From there, click Export Data to export the information as a .csv file so you can add it to your social media report.
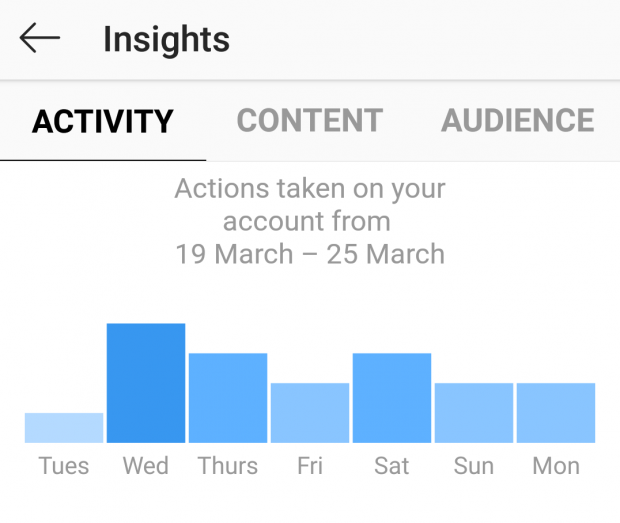
Instagram Insights
Open your Instagram profile and tap on the three bars menu icon on the top right of the screen. Click Insights.
On the first screen, you’ll see activity data like interactions, profile visits, reach, and impressions. Tap on Content or Audience for more details about specific posts or for follower information.
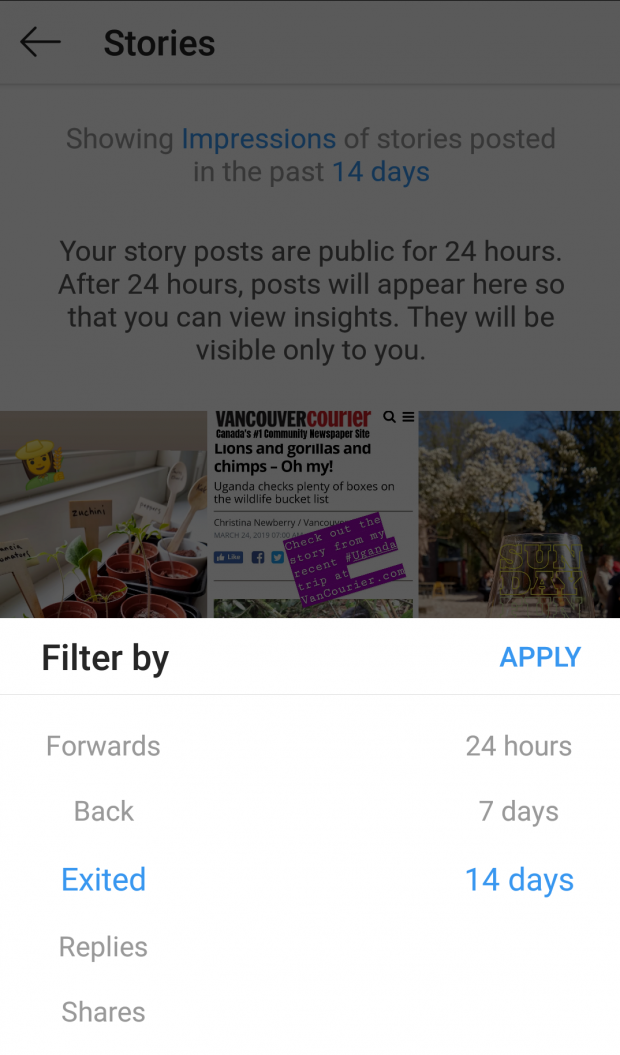
To access stories analytics, tap Content in the top menu, then scroll down to Stories and tap See all.
By default, this screen shows impressions of your stories for the past 14 days. Tap the blue Impressions text to open a menu that allows you to get insights on reach, exits, forwards, and more, and to choose a different time frame.
There is no option to export Instagram analytics data from the app, so you’ll have to manually enter it in your social media report. Keep in mind that Instagram Insights are only available for business accounts.
LinkedIn Analytics
Open your company page and click Analytics in the top menu, then choose Visitors, Updates, or Followers.
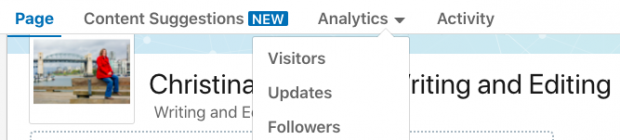
You’ll get access to metrics like traffic, impressions, engagement rate, and new followers. One interesting feature: If you scroll down on the Follower analytics page, you’ll see how you compare to similar companies under the “Companies to track” heading.
To export your data as an .xls file, click the blue Export Data button on the top right.
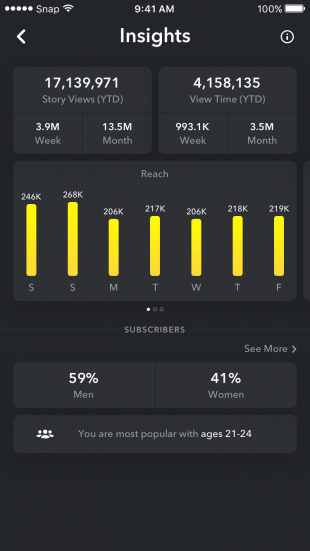
Snapchat Analytics
Snapchat has built-in analytics, but not everyone has access. According to Snapchat, it’s available only to “Snapchatters who are Official Stories or creators who have cultivated a large audience on Snapchat.”
If you qualify, open the Snapchat app, then tap your avatar on the top left to open your profile. Tap Insights, which should appear right under My Story.
You’ll get access to data about story views, reach, view time, and more.
There’s no option to export your data to an .xls or .csv file, so you’ll need to enter it manually in your social media report.
There are also some great third-party Snapchat analytics tools, which you can learn about in our post on how to use Snapchat Analytics.
Pinterest Analytics
From your Pinterest profile, click Analytics on the top left of the screen.
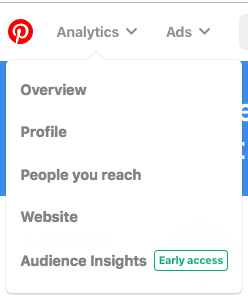
On the overview page, you’ll find information about impressions, viewers, saves, and link clicks. You can get more details by clicking on the various analytics options in the drop-down menu.
For data on your Pinterest ads, click Ads in the top menu, then choose Reporting from the drop-down list.
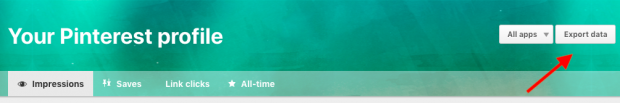
All Pinterest analytics pages except the overview have an Export data button at the top right. Click it to download a .csv file of your data to incorporate in your social media report.
Hootsuite Analytics
Hootsuite Analytics allows you to collect data and create reports for multiple Facebook, Twitter, Instagram, and LinkedIn profiles from one dashboard.
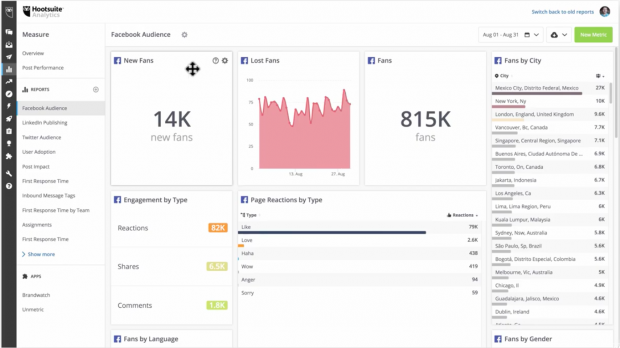
You can customize the dashboard to track the metrics that you’ve identified as most important for your social media report.
When it’s time to create your report and share your data, you can customize what information to include. You’ll have access to a great selection of charts that tell your reporting story in a highly visual way, so the information is easy to consume at a glance.
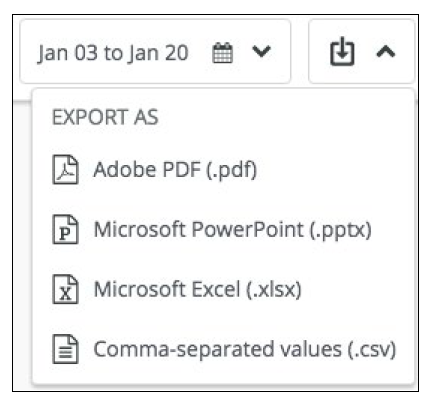
You can share reports with team members directly within the Hootsuite Analytics interface. Or, you can download your complete social media report as a PDF, a PowerPoint, or a spreadsheet file that’s ready to share.
You can get more details on how to make the most of the data available through all of these social reporting tools in our blog post dedicated to social media analytics.
Use Hootsuite to do all your social media reporting from a single dashboard. Choose what to track, get compelling visuals, and easily share reports with stakeholders. Try it free today.
The post How to Create a Social Media Report (Includes a Free Template) appeared first on Hootsuite Social Media Management.
Article syndicated from HootSuite https://blog.hootsuite.com/social-media-report-template-guide/